
Processing and Transport · Quantitative Explanation
Water and Oil Treatment: Conditions for Recycling and Reduced Transport Requirements
1. Produced-fluid separation directs water and oil to their different destinations.
The recovered mixed fluid is separated into gas, oil, water, and other streams. Separators use gravity separation based on density differences and droplet coalescence, and require sufficient residence time. High viscosity, a small oil–water density difference, and entrained solids make separation more difficult. [13]
Produced-Fluid Transfer, Separation, and Impurity Removal
Multiphase Separation of Produced Fluids

A schematic of a separator that divides a mixed fluid into oil, water, and other streams.
U-TOP public program activities diagramHigh-Viscosity Fluid Transfer

A conceptual example of a pump system for transferring a highly viscous mixed fluid.
U-TOP public program activities diagramDesalting and Oil–Water Separation
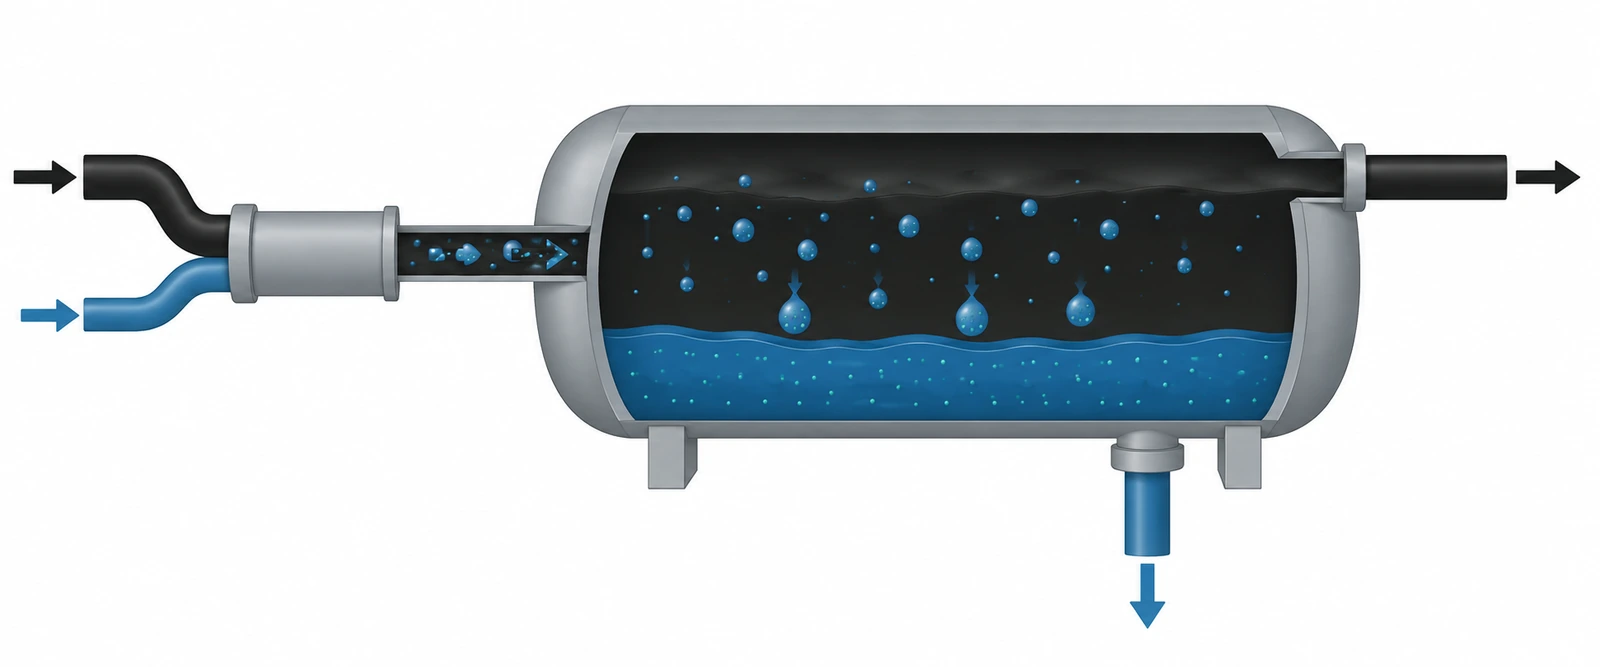
A diagram of a desalting unit that uses droplet coalescence and oil–water separation.
U-TOP public program activities diagramSolids Removal

A schematic of equipment that separates fluid and solids and discharges them separately.
U-TOP public program activities diagramSeparated water is sent for treatment for reuse, while oil is treated according to its residual water, solids, and salt content and transport requirements. Residual constituents from one stage become the treatment load for the next unit. Downstream capacity and operating conditions are set according to the incoming fluid’s flow rate and residual constituent concentrations. [12][13]
2. The recycled water share and total water demand determine make-up water use.
According to AER, total water use in Alberta’s in situ operations was approximately 287 million m³ in 2024, of which 90% was recycled water. Make-up water use was reported separately at approximately 28 million m³. AER rounded the absolute volumes and percentages independently. A precise water balance requires the underlying data. [3]
Share of Total Water Use
Recycled water share (%) Make-up water share (%)
The recycled water share and the absolute make-up water volume are considered separately.
From 2013 to 2024, the recycled water share rose from 82% to 90%, while actual make-up water use reported by AER fell by 3%. Production and total water use also changed as recycled water use increased. [3]
AER’s 2024 nonsaline water intensity was 0.15 barrels (bbl) per Barrel of Oil Equivalent (BOE), or 0.15 bbl/BOE. The numerator is nonsaline water use; the denominator is production expressed in oil-equivalent terms. The recycling rate measures the recycled water share, make-up water volume measures the water supplied from external sources, and nonsaline water intensity measures nonsaline water use per unit of production. [3]
From Oil Removal to Water Recovery
Oil Removal Using Bubbles Generated by Pressure Reduction
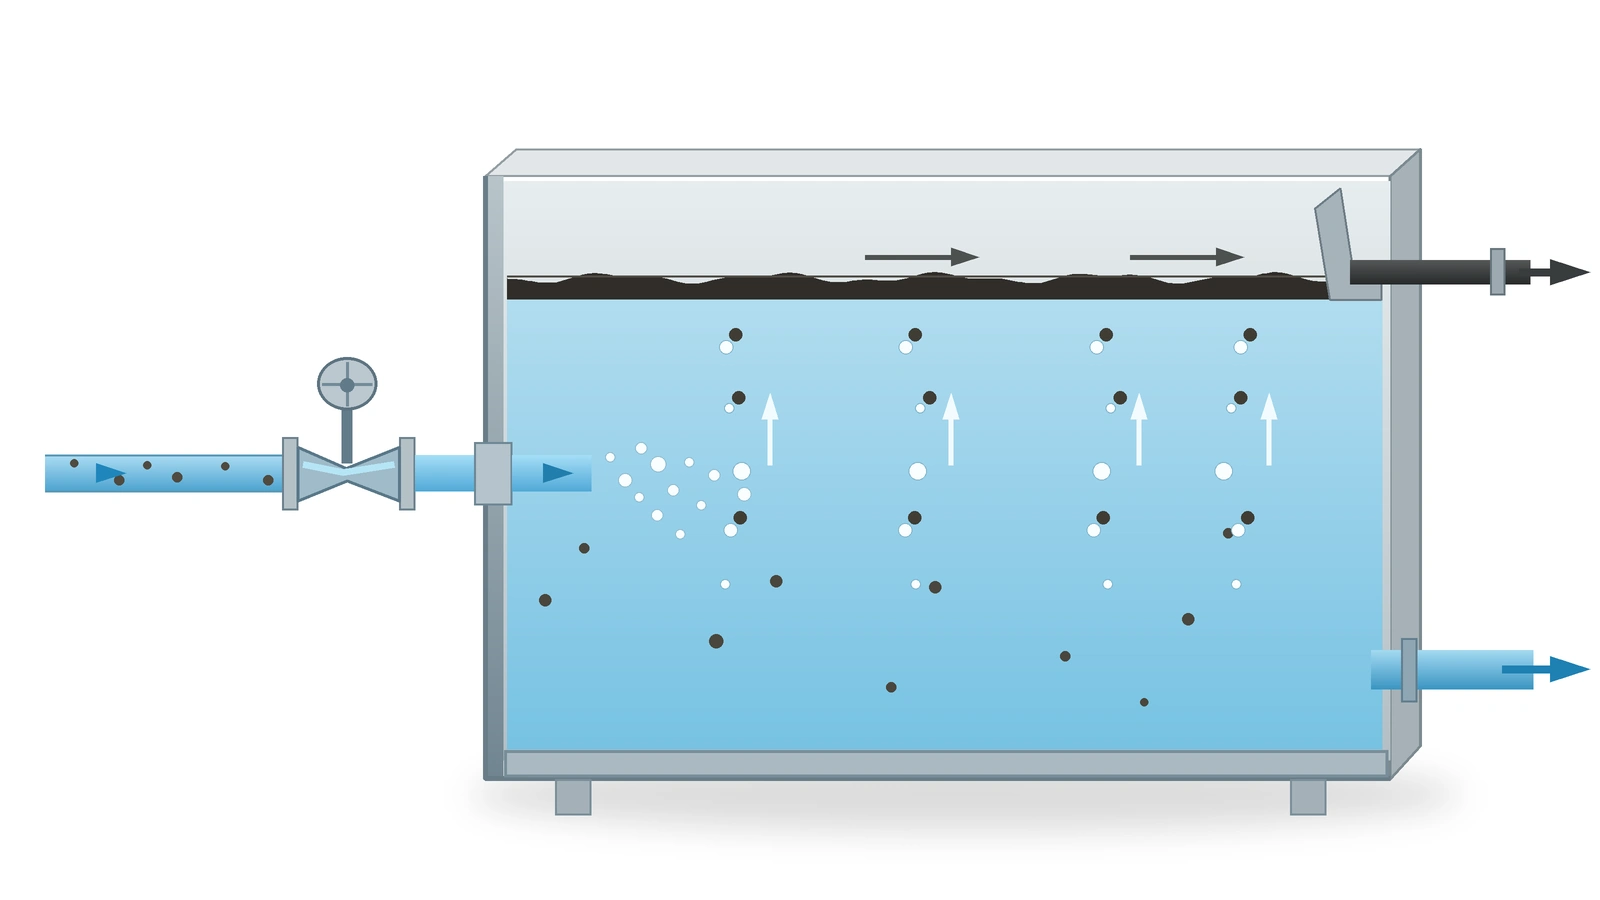
Dissolved gases in pressurized produced water form fine bubbles as pressure is reduced. The bubbles attach to oil droplets and float them to the surface, allowing the floated oil and treated water to be separated and recovered.
U-TOP program activities diagramElectrode and Membrane Processes

A conceptual example of a treatment unit using electrodes and membranes. Removal targets and performance depend on the equipment’s characteristics and operating conditions.
U-TOP public program activities diagramMembrane Separation and Water Recovery

A conceptual example linking membrane separation to a downstream water-recovery system. The process configuration is selected according to inlet-water properties and the quality required for reuse.
U-TOP public program activities diagramWater treatment is configured according to raw-water properties and the quality required for reuse as feedwater. Softening, membrane separation, evaporation, and condensation are combined to address residual oil, hardness, silica, dissolved constituents, and other removal targets. Recovered-water quality and methods for handling concentrate and sludge are determined together. [12]
3. Reducing diluent changes the volume needed to transport the same amount of bitumen.
Dilution adds a light fluid to produce a blend suitable for transport. Partial upgrading improves properties by converting or removing some components, with the aim of reducing diluent requirements. Full upgrading produces synthetic crude oil through more extensive processing. The objectives and costs of these three approaches must therefore be distinguished. [6][11]
Alberta Innovates’ 2018 white paper describes cases in which condensate constitutes approximately 30 vol% or more of the final blend for pipeline transport of bitumen. This figure comes from transport cases presented in the 2018 white paper. The diluent fraction for a particular application is selected according to feedstock properties and route-specific transport specifications. [6]
With bitumen production set at 1,000 barrels/day, this comparison uses diluent fractions of 30 vol% and 15 vol% of the final blend. Volumes are assumed to be simply additive, with no yield loss from upgrading. This comparison model uses 30 vol% as the baseline and 15 vol% as the assumed reduction case.
Blended Oil Volume for Transporting the Same Amount of Bitumen
Bitumen (barrels/day) Diluent (barrels/day)
The blended oil volume falls by approximately 17.6%.
| barrels/day | 30 vol% | 15 vol% |
|---|---|---|
| Bitumen | 1,000.0 | 1,000.0 |
| Diluent | 428.6 | 176.5 |
| Total Blended Oil | 1,428.6 | 1,176.5 |
Blended oil volume = bitumen volume ÷ (1 − diluent volume fraction in the final blend)
In this comparison model, a lower diluent fraction reduces the amount of diluent to purchase and handle and the volume of blended oil to transport. An economic evaluation accounts for savings in diluent and transport costs, upgrading capital, energy and operating costs, product yield, and specifications. [6]
Partial Upgrading and Reaction Processes: Concepts
Partial Upgrading and Improved Flowability

A schematic qualitatively illustrating changes in flowability resulting from oil treatment.
U-TOP public program activities diagramCatalyst and Reaction Evaluation
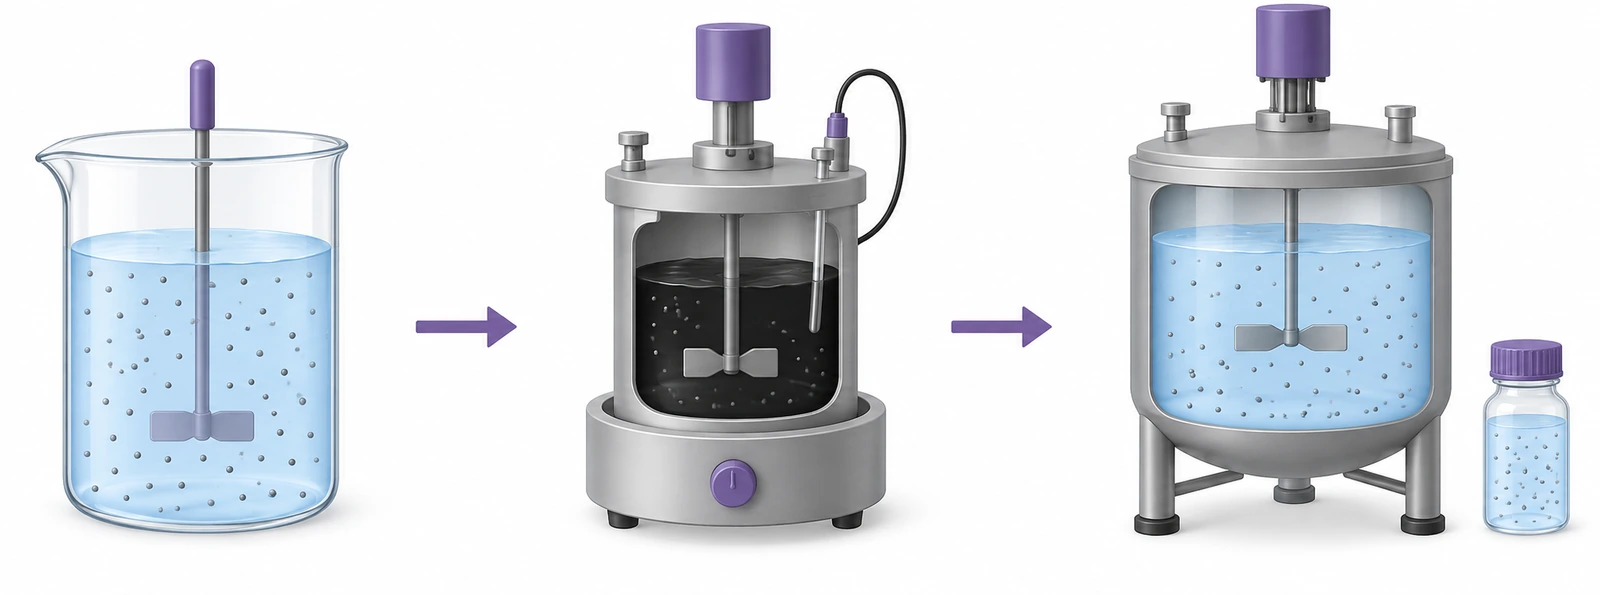
A concept for developing and evaluating reactions in a catalytic process. The catalyst is selected to suit the feedstock properties and the target reaction.
U-TOP public program activities diagram4. Equipment combinations are selected based on whole-process performance and cost.
| Improvement Objective | Figures to Consider Together | Associated Costs and Processing Loads |
|---|---|---|
| Oil and Impurity Removal | Downstream Inlet Concentration and Flow Rate | Chemicals, Cleaning, and Waste |
| Increased Water Recycling | Recycling Rate and Absolute Make-up Water Use | Water Quality Maintenance, Energy, and Concentrate Treatment |
| Diluent Reduction | Blended Oil Volume, Product Yield, and Properties | Upgrading Capital and Operating Costs, and Transport Specifications |
Energy, water, chemical use, and transport volumes for different equipment combinations are compared at the same production rate. The effects of changes in each unit’s performance on downstream inlet conditions and loads are calculated to select the combination that best supports overall plant economics.
References and Statistical Basis
- AER, In Situ Oil Sands — Water Use Performance (2024 observations)
- Jacobs Consultancy / Alberta Innovates, Bitumen Partial Upgrading 2018 Whitepaper, pp.5–8
- Natural Resources Canada, Oil Sands Extraction and Processing
- Sadrzadeh et al., Nanofiltration for Oil Sands-Produced Water (2018)
- SLB, Multiphase Separators
Each figure is labeled with its statistical period, coverage, and unit. Experimental results include test conditions, while assumed calculations state the fixed conditions and formulas.