
Production and Energy · Quantitative Explanation
SAGD and ES-SAGD: Steam, Solvent, and Productivity
1. A lower steam-oil ratio reduces the steam required for the same production volume.
Steam-Assisted Gravity Drainage (SAGD) injects steam through an upper horizontal well and recovers heated bitumen and water through a lower production well. The Steam–Oil Ratio (SOR) is the volume of steam injected per unit volume of bitumen produced, with steam expressed as its equivalent liquid-water volume. An SOR of 3 means injecting steam equivalent to three barrels of water to produce one barrel of bitumen. [2]
Development of the Heated Region and Gravity Drainage
Preheating and Initial Heating
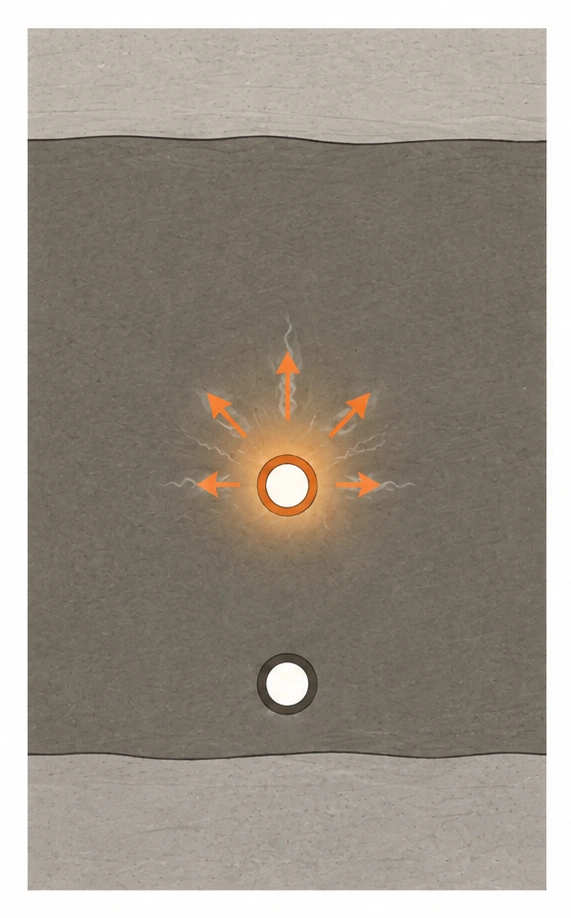
A schematic of the initial stage, when the areas around the injection and production wells are heated.
U-TOP public program activities diagramSteam Chamber Development
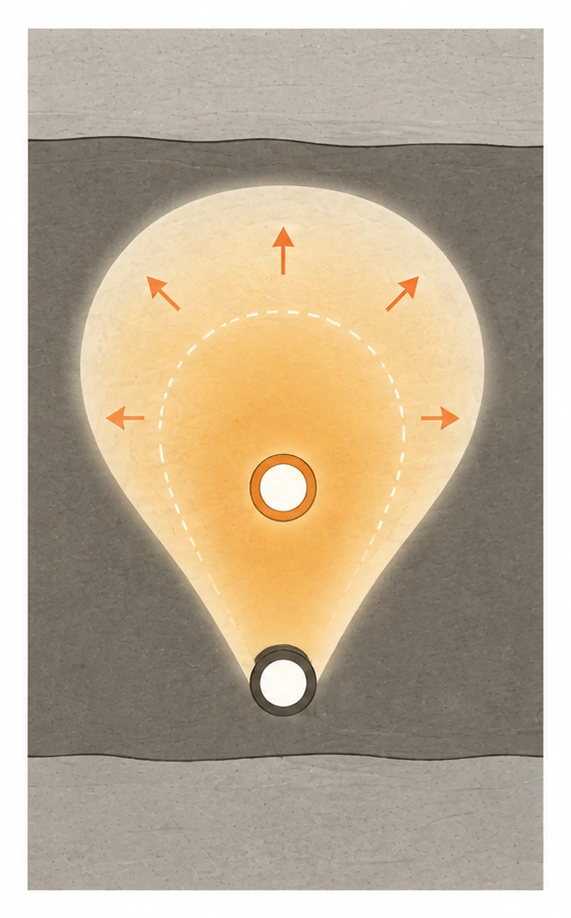
This shows how the heated region develops as heat is transferred.
U-TOP public program activities diagramExpansion of the Heated Region and Drainage
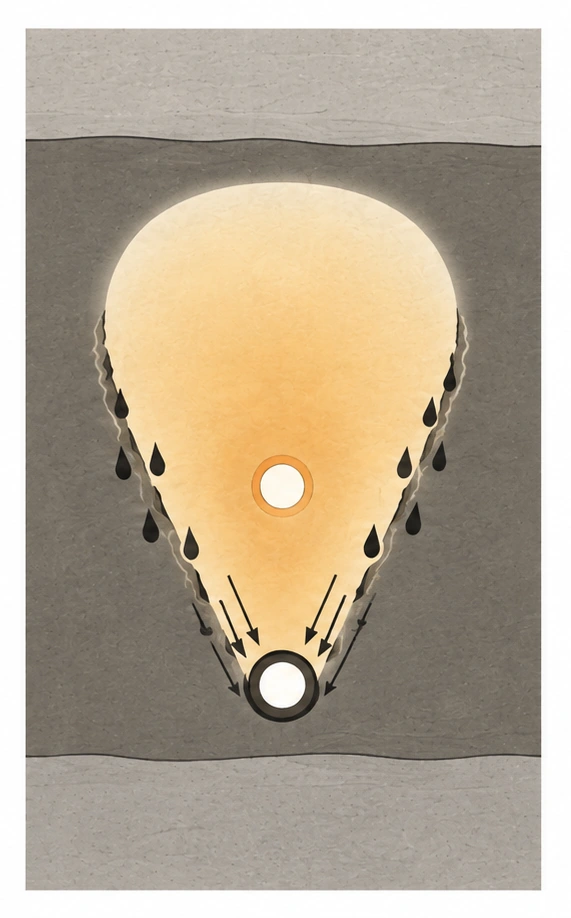
This illustrates how heated bitumen moves to the lower production well.
U-TOP public program activities diagramLong-Term Changes in Average SOR by Recovery Method
The SAGD average fell by approximately 9.9%.
The average SOR for SAGD fell from 2.94 to 2.65. By contrast, the average for Cyclic Steam Stimulation (CSS) rose from 3.83 to 5.17. Method-level averages reflect differences in the mix of fields, development stages, and reservoir conditions. Comparing individual projects requires data matched for these conditions. [2]
With steam conditions and equipment efficiency unchanged, a reduction in steam volume reduces the heat and fuel required. Actual percentage savings in fuel costs and emissions are calculated using steam pressure and quality, equipment efficiency, recovered heat, and feedwater conditions. [2]
2. Total emissions increased because production grew faster than emissions intensity improved.
In the 2010–2020 data compiled by CER, production from steam-based in situ recovery increased from 760,000 to 1.5 million barrels per day. Over the same period, total greenhouse gas emissions rose from 22.7 million to 41.2 million tonnes CO₂e. Emissions intensity per barrel produced fell by approximately 8%, but total emissions increased as production grew by a larger proportion. [2]
Compare Growth Using a Common Base Year
= Total emissions
The change in total emissions is calculated by multiplying the relative changes in production and emissions intensity.
Emissions intensity measures emissions per barrel produced, while total emissions measure emissions from all production. Together, these indicators show changes in production efficiency and the overall scale of an operation’s emissions.
3. ES-SAGD combines heat with the diluting effect of solvent.
Expanding Solvent–Steam-Assisted Gravity Drainage (ES-SAGD) co-injects steam and a hydrocarbon solvent. Solvent condensing at the steam chamber boundary dilutes the oil and works with heat transfer to reduce bitumen viscosity. The solvent’s phase behavior must be compatible with the injection pressure and temperature. [5]
SAGD
Higher Temperature Reduces Bitumen Viscosity
ES-SAGD
Combining the Effects of Heat and Solvent
The original 2003 paper compared experimental groups under these conditions. In those experiments, the average oil drainage rate with a hydrocarbon diluent co-injected with steam was reported to be approximately 3 times that with steam alone. [5]
The approximately 3-fold figure is the ratio between the average oil drainage rates measured in that experiment. Results varied with the solvent type and vaporization and condensation conditions. Evaluating field recovery and economics requires reservoir-specific conditions, long-term operating data, and a solvent balance. [5]
The effect of introducing solvent is evaluated by comparing increased production, steam savings, and the requirements for solvent purchasing, retention, recovery, and reuse under the same operating conditions. Selecting an injection solvent requires analysis of its phase behavior and the production response in the reservoir concerned. [5]
4. Surface processing capacity supports improvements in reservoir production.
Steam Generation and Surface Recovery Facilities
Steam Generation Unit
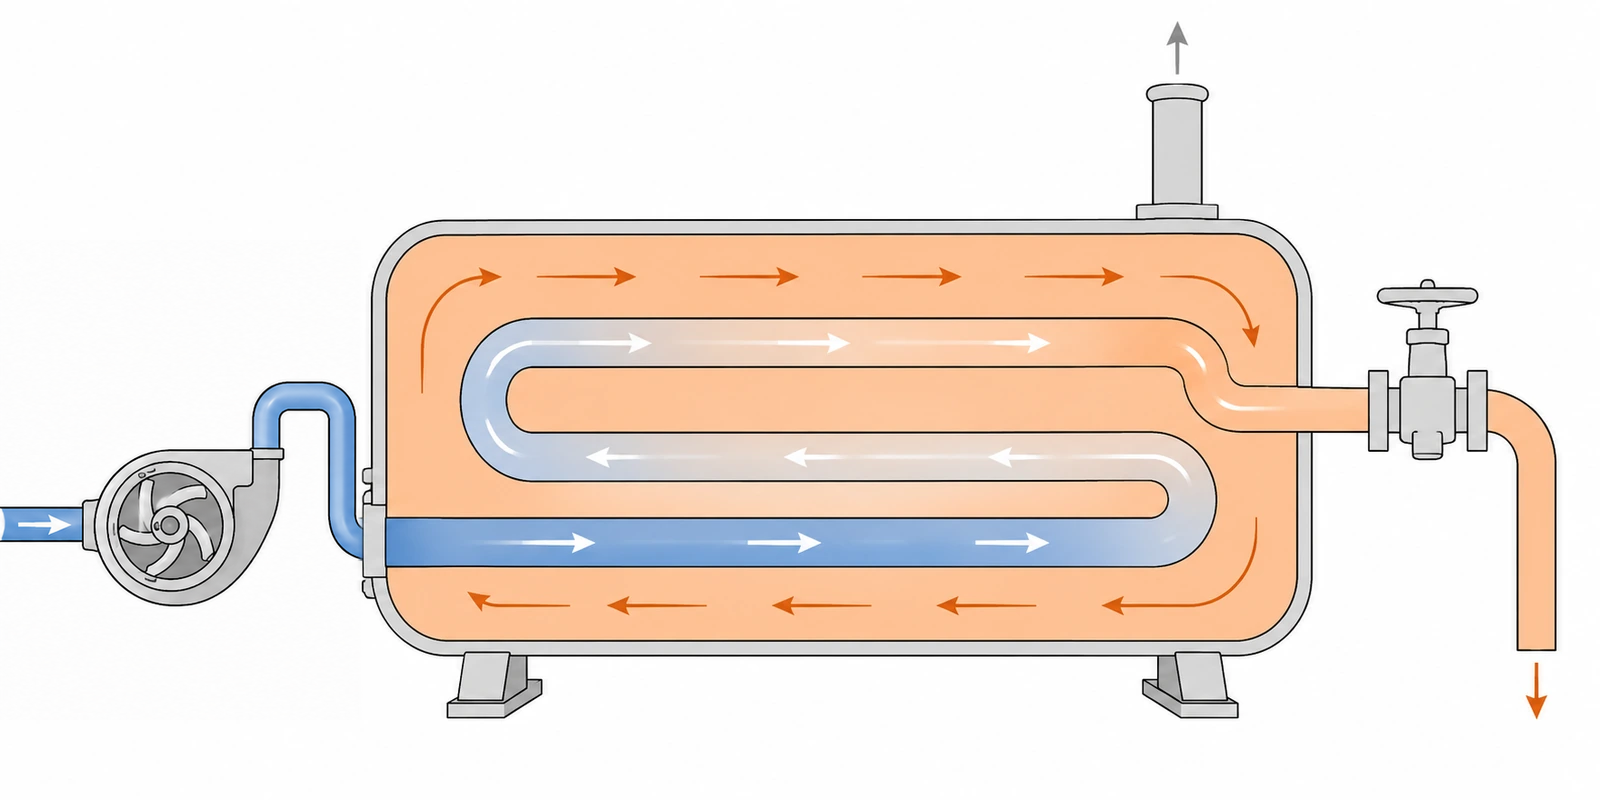
An equipment diagram linking water supply, heating, and steam supply.
U-TOP public program activities diagramWell Pad and Produced-Fluid Recovery
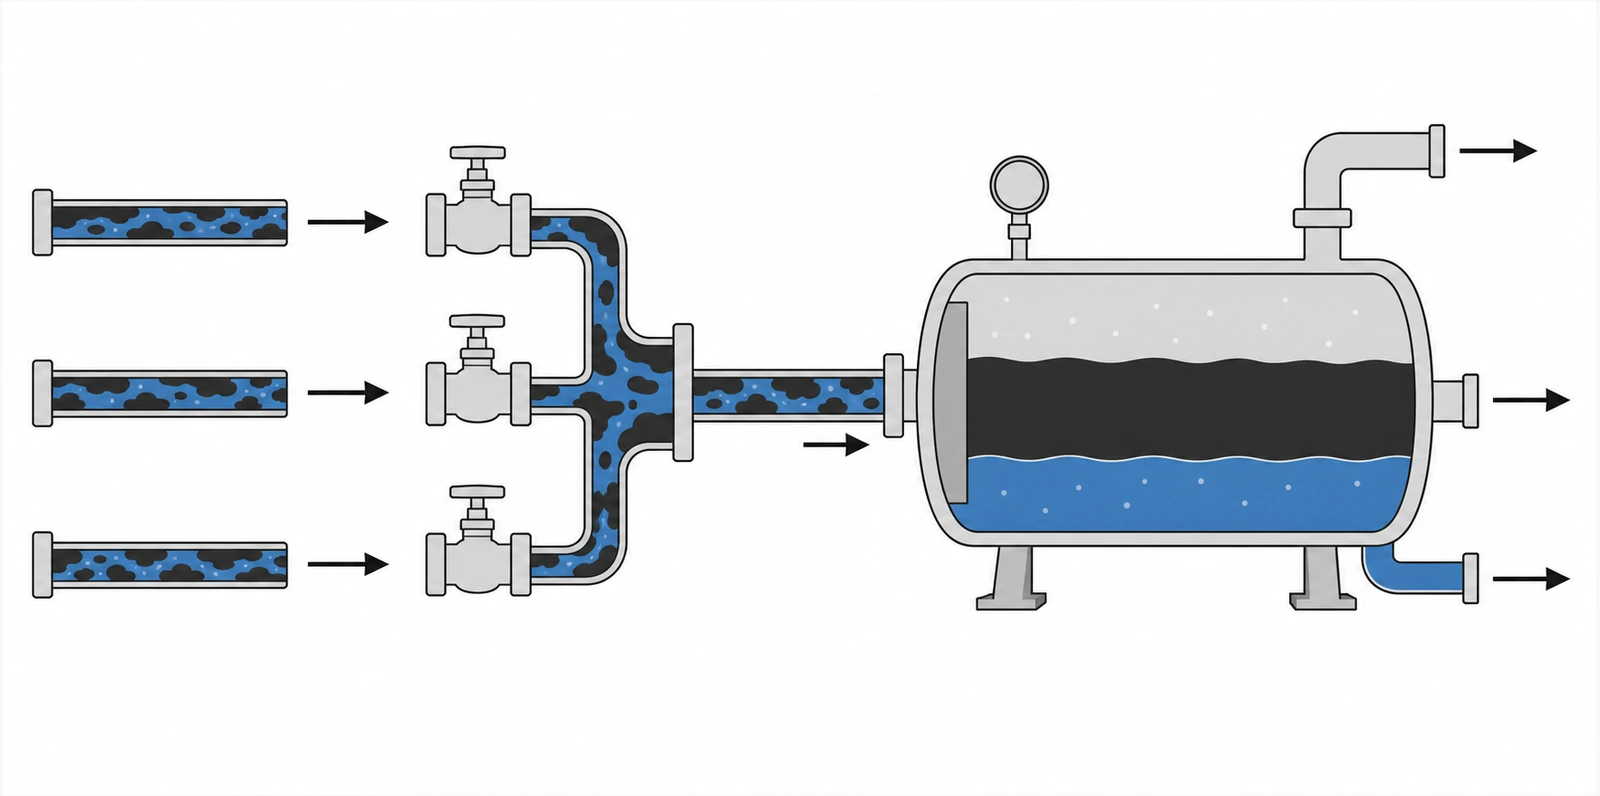
A schematic connecting fluids recovered from wells to surface gathering and separation facilities.
U-TOP public program activities diagramSolvent Recovery and Reuse
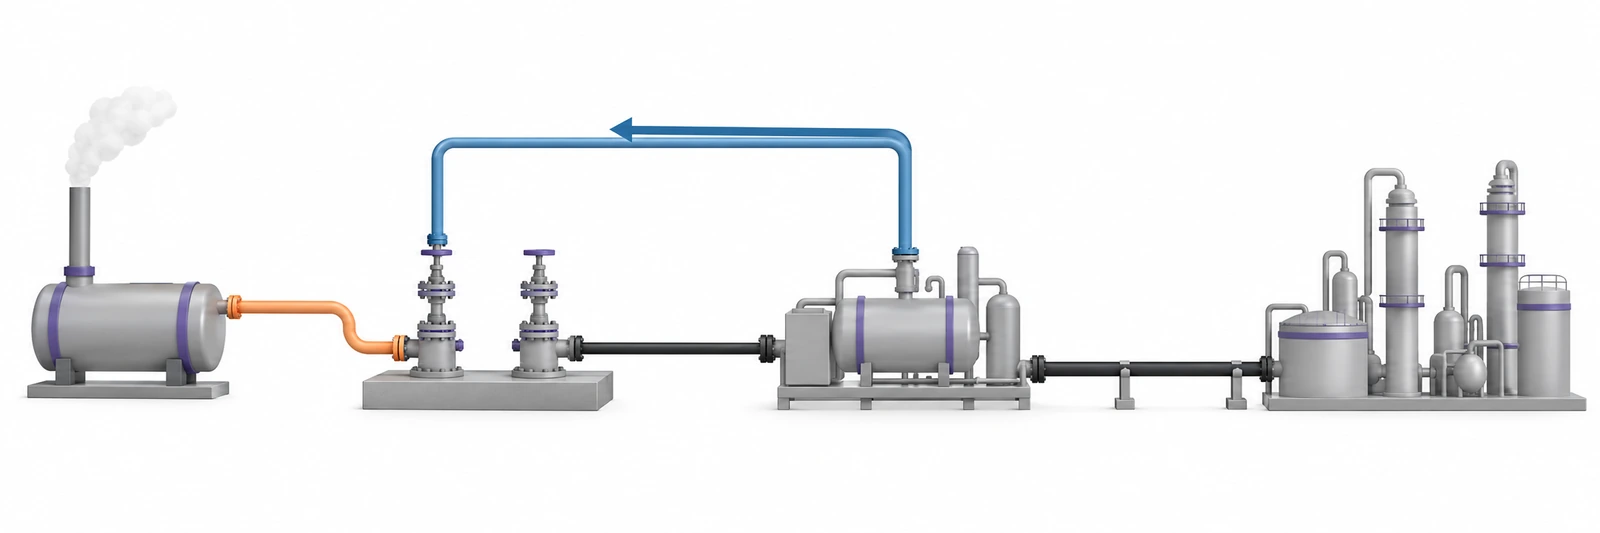
A conceptual example of recovery and recirculation in a solvent-based process. The substances recovered and the losses depend on separation conditions.
U-TOP public program activities diagramSteam, water, and solvent circulation are designed together.
Produced fluids contain bitumen, water, and recovered injected substances. At the surface, these are separated and brought to the required water quality and fluid properties before reuse or further treatment. [2][12][13]
Overall process economics depend on savings in steam generation and additional costs for water treatment and solvent recovery. The next explanation connects recycling rates and diluent fractions with actual water-use statistics and a volume balance.
References and Statistical Basis
- CER, Trends in In-Situ Bitumen Production (2023-03-15; SOR 2010–2021, emissions 2010–2020)
- Novel Expanding Solvent-SAGD Process ES-SAGD (2003; laboratory tests)
- Sadrzadeh et al., Nanofiltration for Oil Sands-Produced Water (2018)
- SLB, Multiphase Separators
Each figure is labeled with its statistical period, coverage, and unit. Experimental results include test conditions, while assumed calculations state the fixed conditions and formulas.